Tutorial: Debugging and Comparing Pipeline Runs with Traces
Every pipeline run leaves behind a trace: a complete record of what happened from the moment a query came in to the moment an answer went out. In this tutorial, you'll use traces to drill into a single component run, figure out why a run failed, compare two runs side by side, and fix a broken component directly from the trace in Builder.
- Level: Intermediate
- Time to complete: 20 minutes
- Prerequisites:
- An Editor role in the workspace.
- A deployed pipeline that includes a component calling an external model, such as a
Generator,LLM, orAgentcomponent. If you don't have one, complete the Tutorial: Building a Robust RAG App first. - Basic knowledge of Haystack Enterprise Platform and Builder.
- Goal: After completing this tutorial, you'll have inspected a component run inside a trace, diagnosed why a run failed, compared two runs to see how they differ, and used a trace to reproduce and fix a failing component in Builder.
Traces are collected for queries run on or after 25 June 2026. Before that date, traces are not available. To collect traces for pipelines deployed before that date, undeploy the pipeline and deploy it again.
Generate a Few Traces to Work With
Traces need no setup: every run of a deployed pipeline is captured automatically. Let's create a handful of runs so you have something to inspect, compare, and debug.
- In Haystack Enterprise Platform, go to Pipelines, find your deployed pipeline, and click Playground next to it.
- In Playground, run two different queries, for example a short, specific question and a longer, more open-ended one. You'll use these two runs later to compare how the pipeline behaves with different inputs.
- Create a failed run on purpose, so you have something to debug later:
- Go to Build and switch to the YAML view.
- Find the
Generator,LLM, orAgentcomponent in your pipeline and change its model to a name that doesn't exist, for exampledoes-not-exist. - Deploy the latest version of your pipeline. Don't worry, you can always restore your good version later.
- Go back to Playground and run a query. The run fails because the model name is invalid.
Result: You have at least three traces: two successful runs with different inputs, and one failed run caused by an invalid model name.
Open a Trace and Drill into a Component Run
- Go to Analytics and open Traces.
- You can see a list of your recent runs, each with its input, status, source, duration, total tokens, and timestamp. Find one of the two successful runs and click it to open its details.
An example of a successful run:
In the Spans section, you can see a hierarchical tree of every component that ran, with its own duration and status. The Waterfall panel next to it lays out the same spans on a timeline, so you can see at a glance which step took the most time.
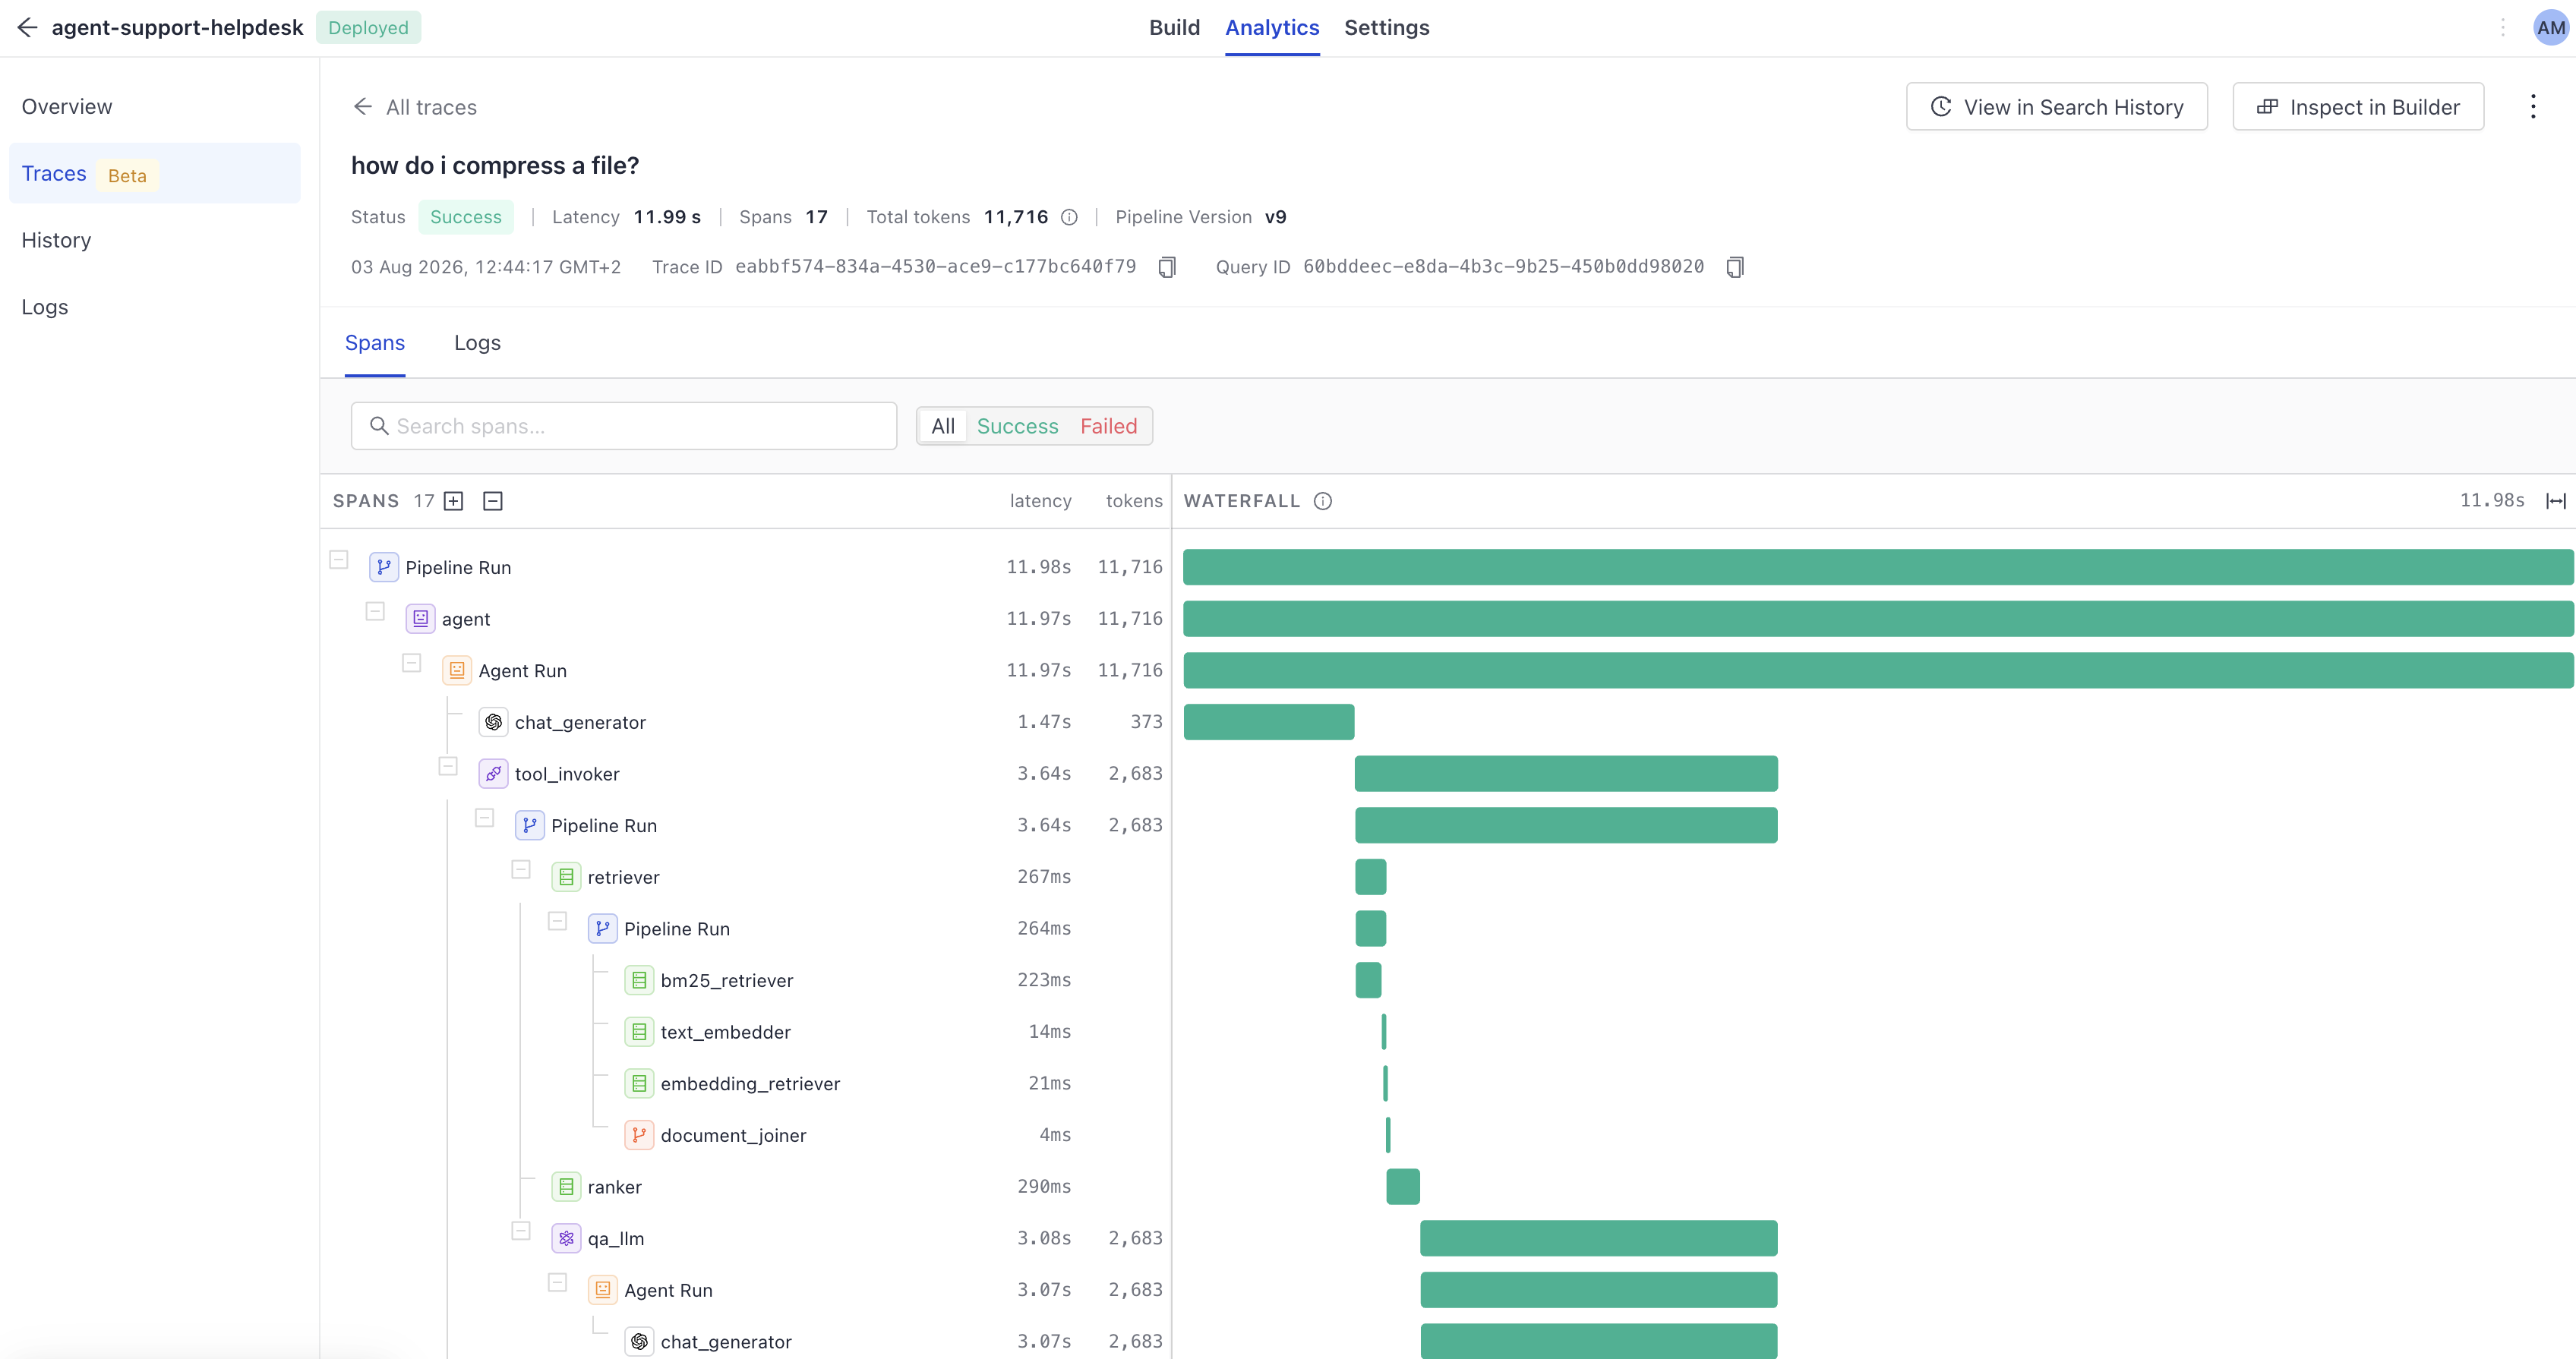
- Click the span for your
Generator,LLM, orAgentcomponent run. - In the span details, check:
- Input and output: the exact data the component received and returned.
- Duration: how long this specific step took, compared to the rest of the run in the Waterfall panel.
- Tags: metadata like the component type and, for model-calling components, token usage broken down by prompt, completion, reasoning, and cache tokens.
Result: You've drilled into a single component run and seen exactly what it received, what it returned, how long it took, and how many tokens it used.
Identify What's Wrong
Now let's find out why the third run failed.
- Go back to Traces and open the run that failed.
- At the top of the trace, check the status and the root cause component. Haystack Platform automatically flags the component where the failure happened, so you don't have to walk through every span to find it.
An example of a failed run:
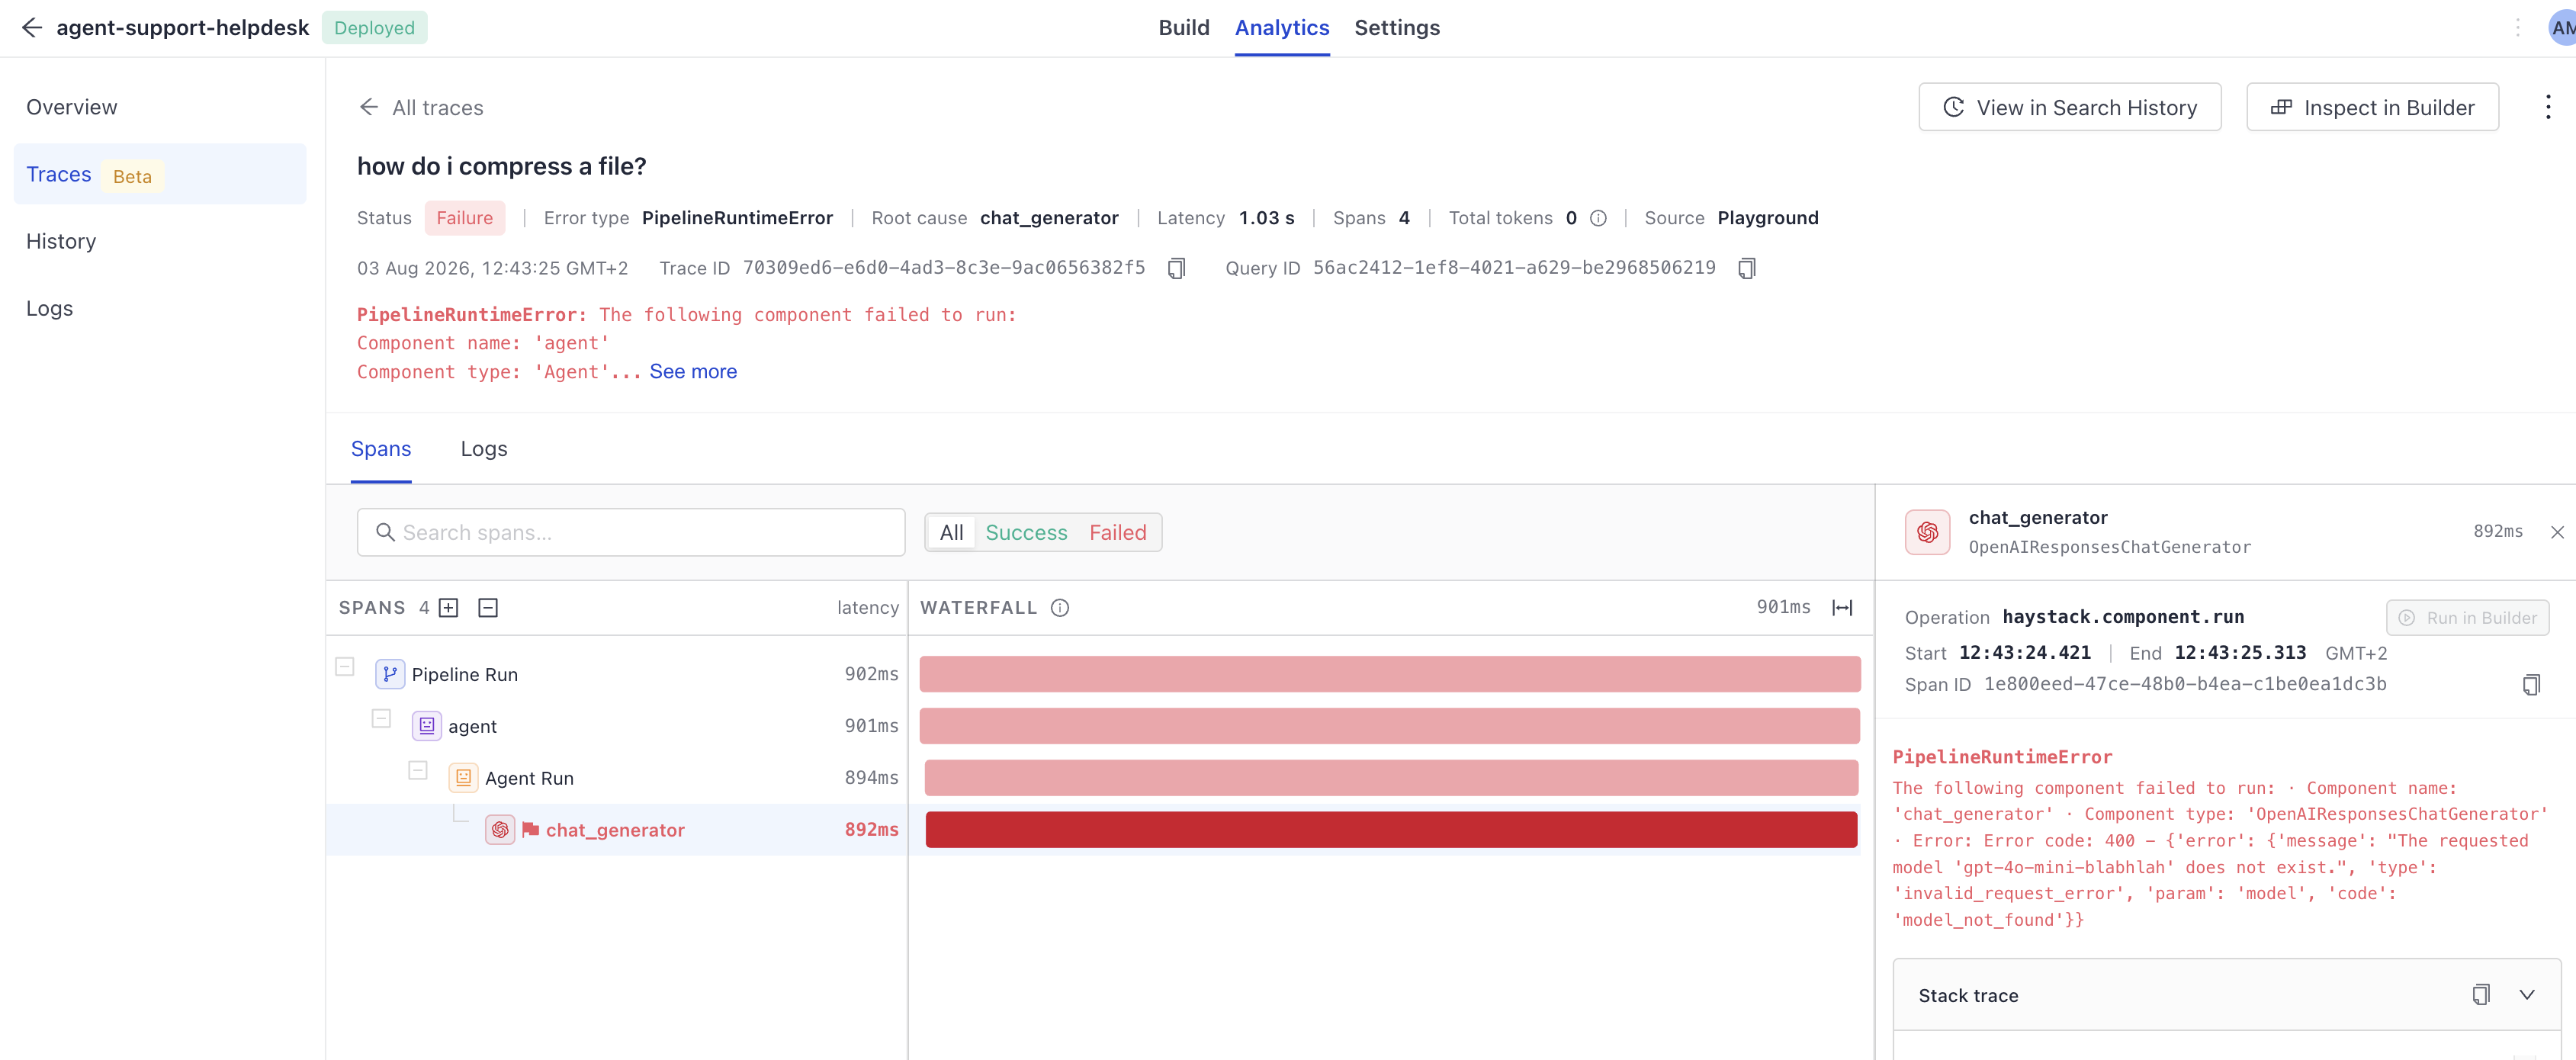
- Open the flagged span. Its details include the exception type, the error message, and the full stack trace.
- Read the error message. Since you set an invalid model name, the message should point to that as the cause.
- Scroll down to the Logs section for the span to check the log entries recorded during that step for more context.
Not every failure needs a code fix. A trace tells you whether a failure is a configuration error you're responsible for fixing, like the invalid model name in this tutorial, or an external provider or infrastructure error that usually just needs a rerun.
Result: You've identified the root cause of a failed run and understand whether it's a problem you need to fix or one you can retry.
Compare Two Traces
With Compare, you can see exactly how two runs differ, side by side, at each component.
- Go back to Traces and enable Compare.

- Choose the two successful runs you created at the start of this tutorial.
- Choose a component from the pipeline run section. You can see its inputs and outputs, duration, and token consumption for each run, with differences highlighted.
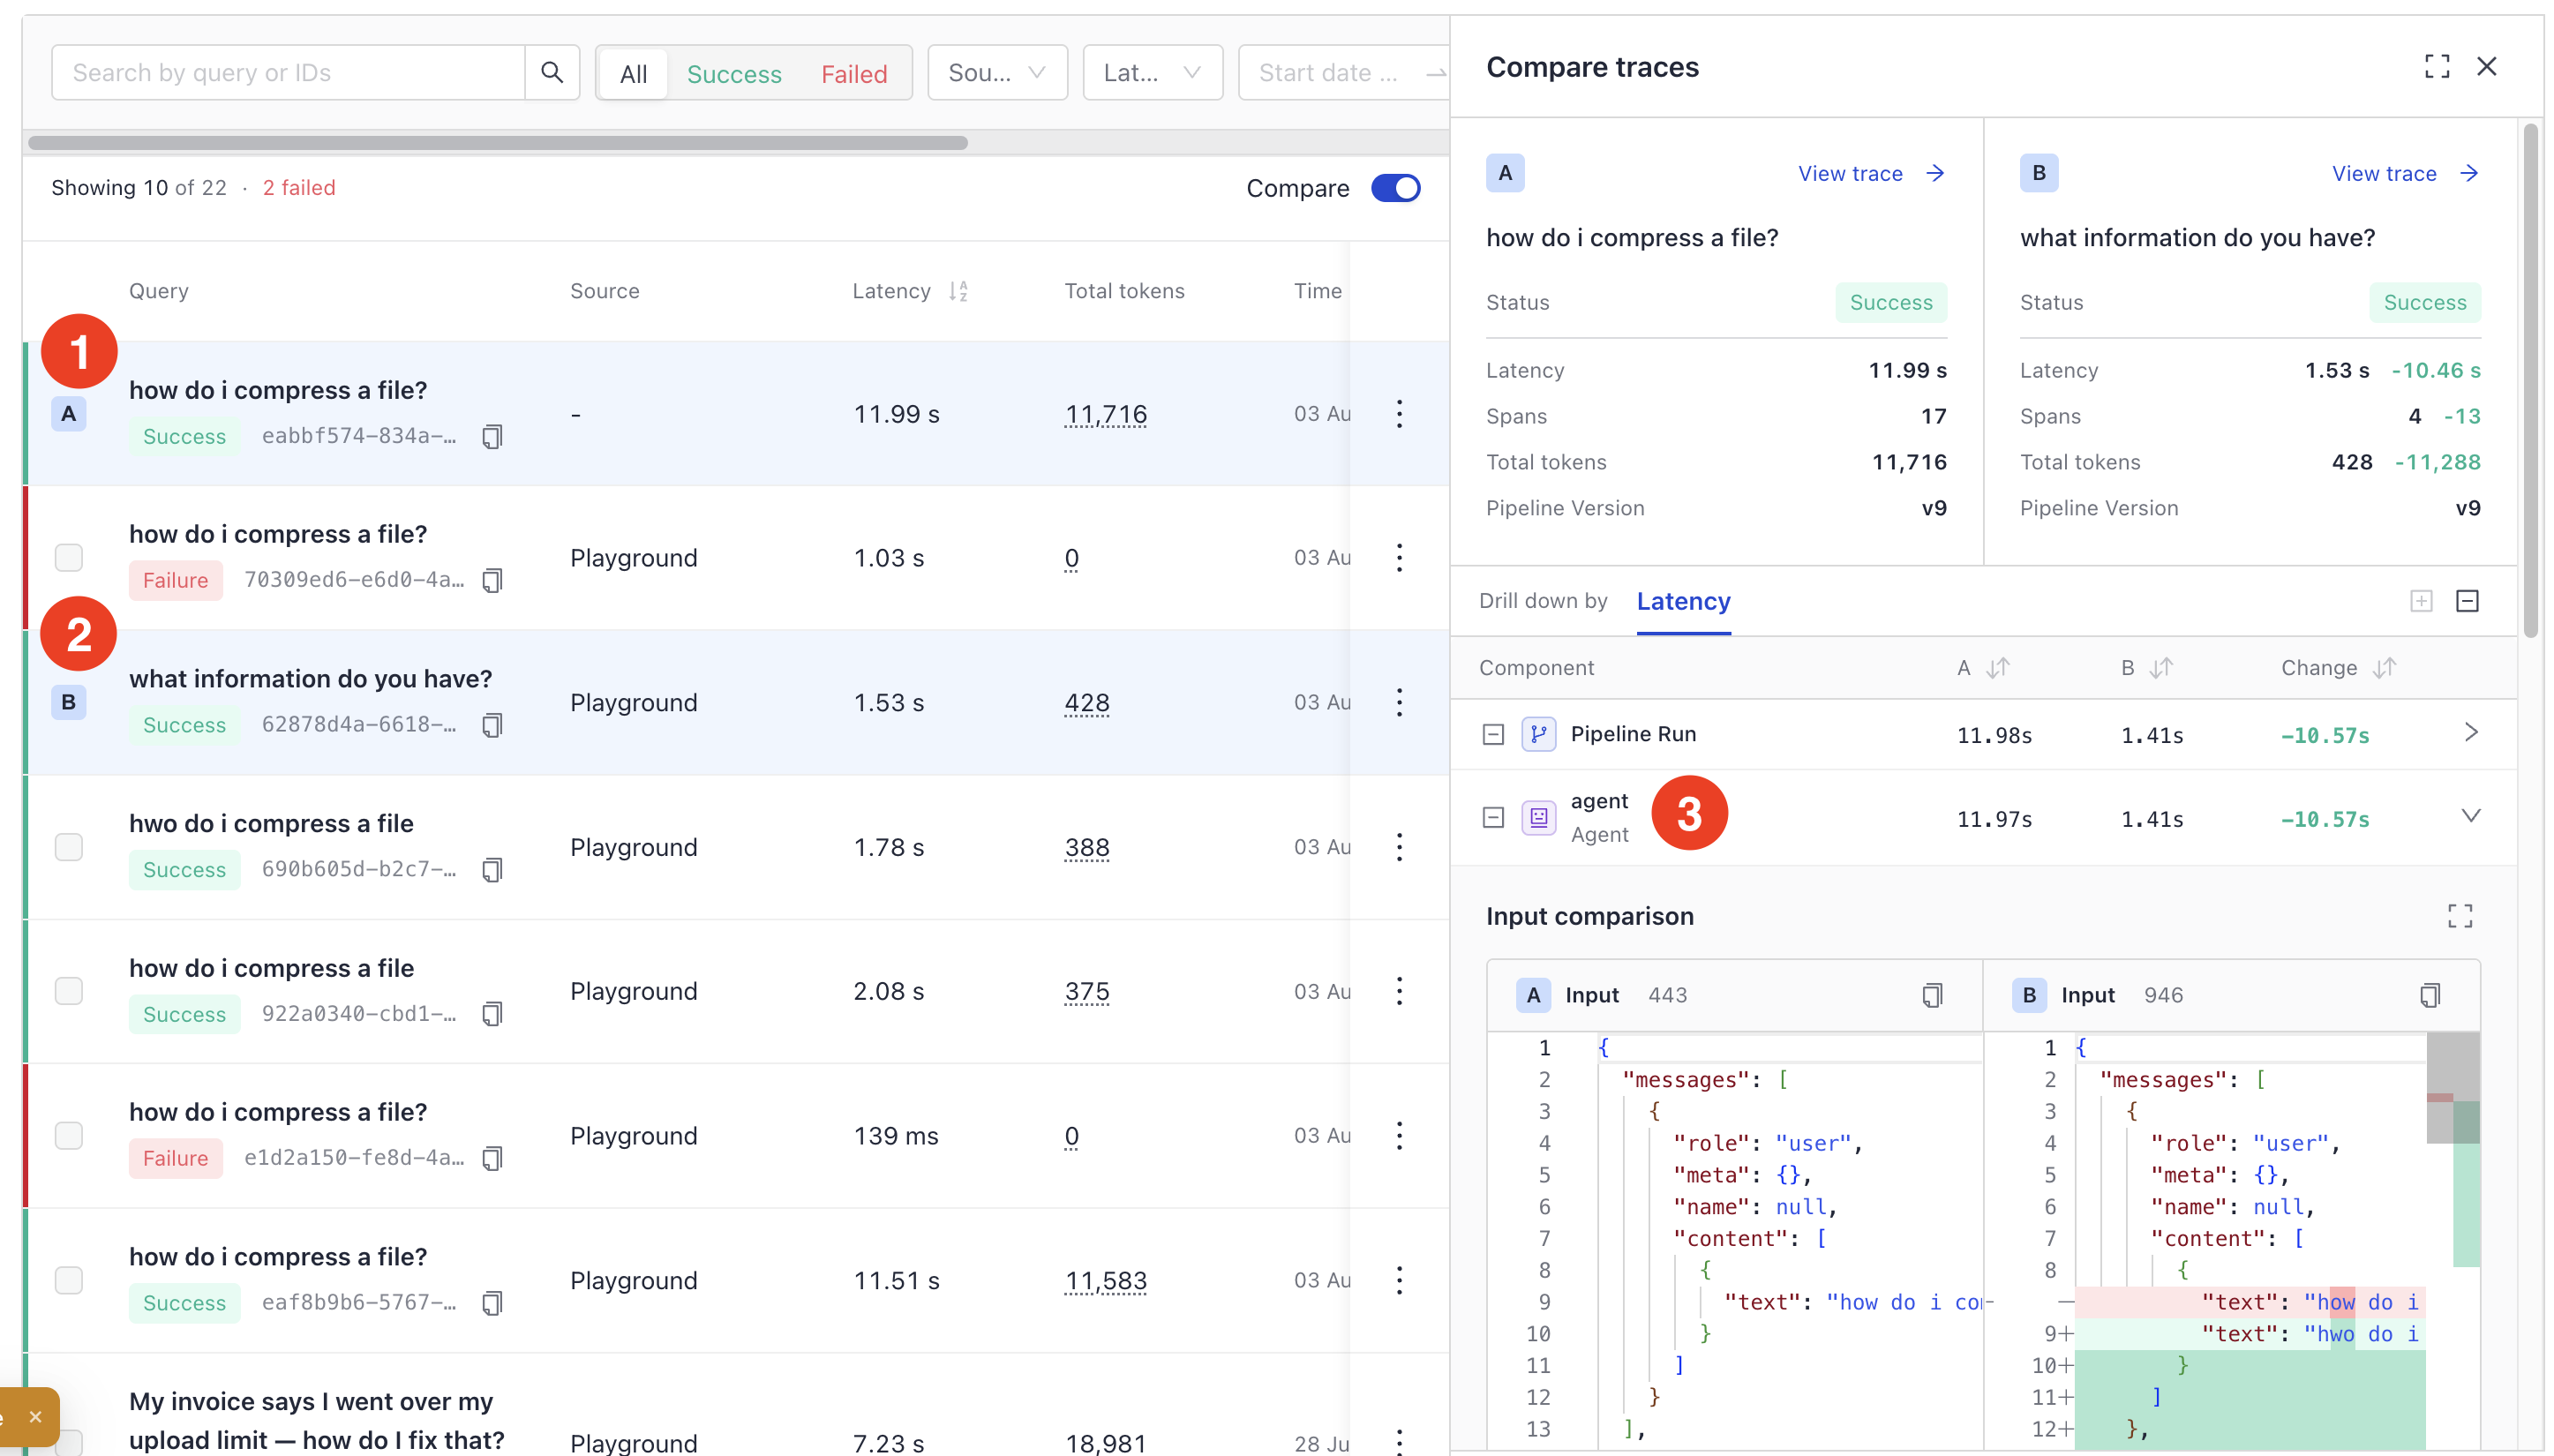
- Check how the queries compare: which components took longer and used more tokens.
Compare also works across pipeline versions. Run the same input against a previous version and the current one to catch a regression, like a component that got slower or started returning something different.
Result: You've compared two runs side by side and can see exactly how a different input changes duration, token consumption, and the answer at each component.
Fix and Rerun a Component in Builder
Let's fix the broken model name using the failed trace as your starting point.
- Close the comparison view and open the failed run again. In the trace detail view, the failed span is already selected for you.
- Click Run in Builder on the span. You may need to choose the component span, for example, an agent span rather than an underlying chat generator span.
Builder opens with the component run widget, pre-filled with the exact input from the trace.
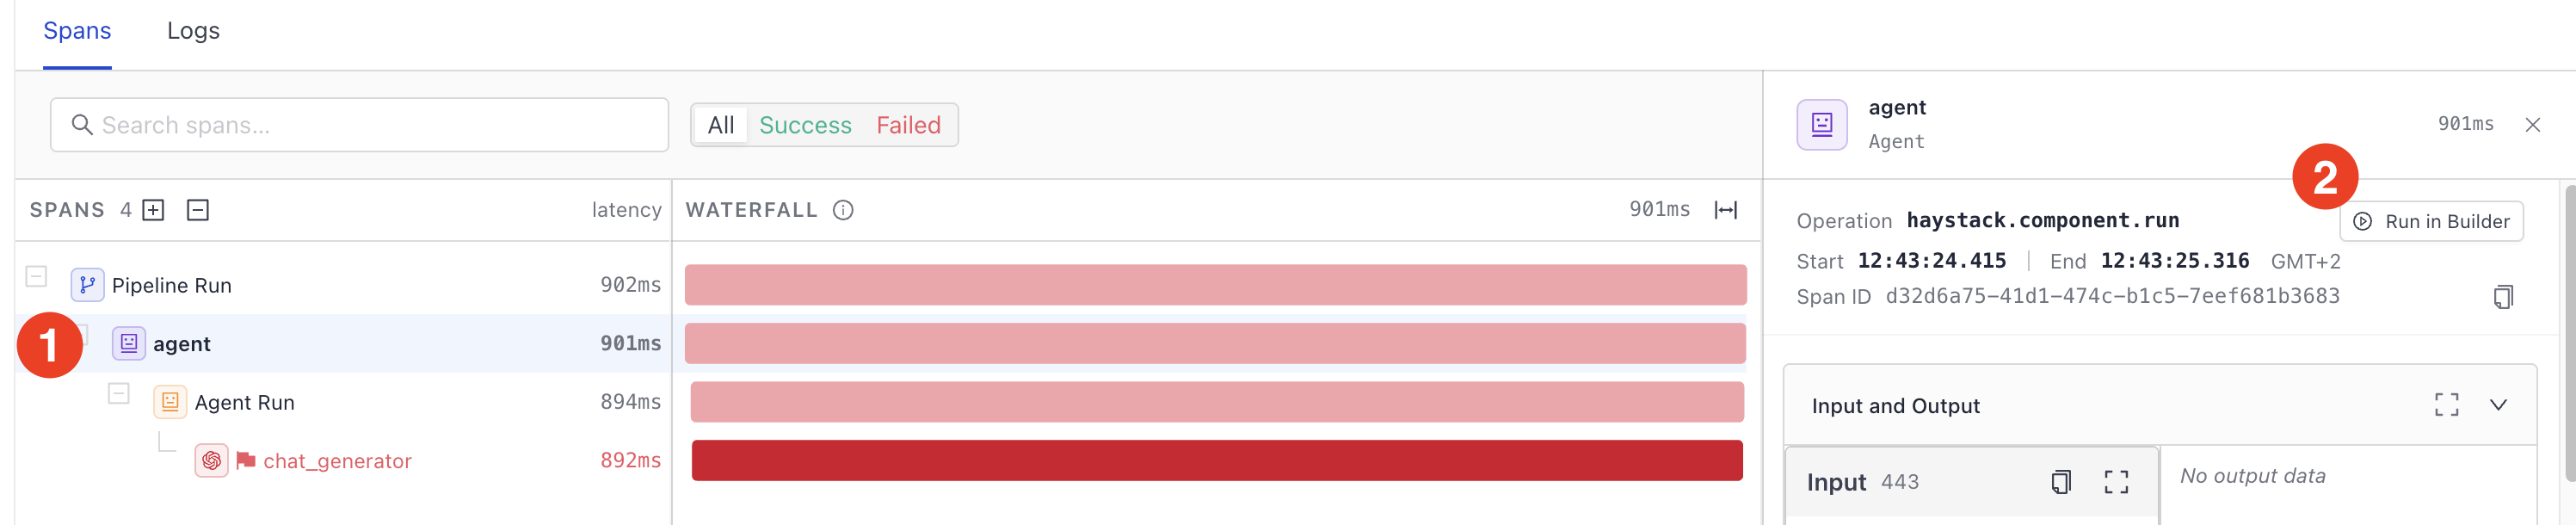
- Switch to the YAML view and fix the Model field: set it back to a valid model name.
- Switch back to the Builder view.
- In the component run panel, click Fill input from trace to load the original input again, then click Run Component.
- Check that the component now runs successfully with the same input that failed before.
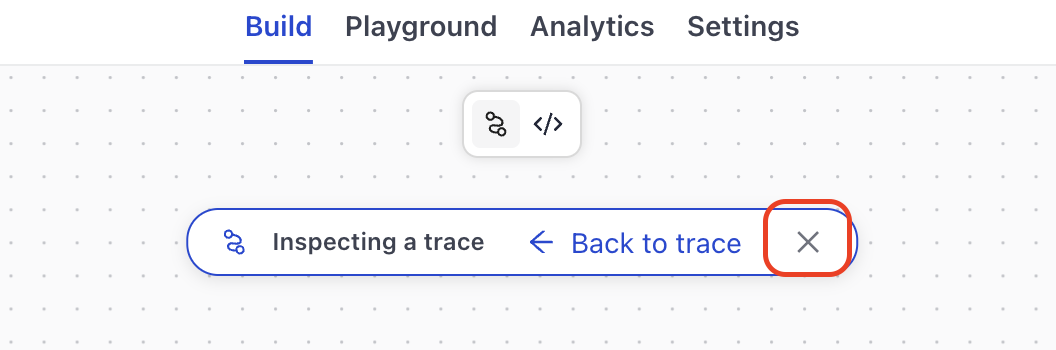
- Close the inspecting trace indicator to leave trace mode and return to normal Builder mode.
- Deploy the pipeline so the fix applies to real traffic. For details, see Deploy a Pipeline.
Result: Congratulations! You've used a trace to reproduce a failing component with its exact input, fixed the underlying configuration issue, confirmed the fix in Builder, and deployed it.
Related Information
Was this page helpful?