Understand Your Pipeline Usage
You can monitor your current pipeline usage, pipeline hours, and document storage units (DSU) anytime on the Usage dashboard.
You must be an Organization Admin to view the Usage dashboard.
Navigating the Usage Dashboard
All your usage information is visible on the Usage dashboard, which you can access from organization settings:
- Click your profile icon and choose Settings.
- Go to Organization>Usage.
The top of the dashboard shows a summary of all the information. To see how the data breaks down by pipeline, check the table at the bottom of the dashboard.
In the summary, you can check the following information:
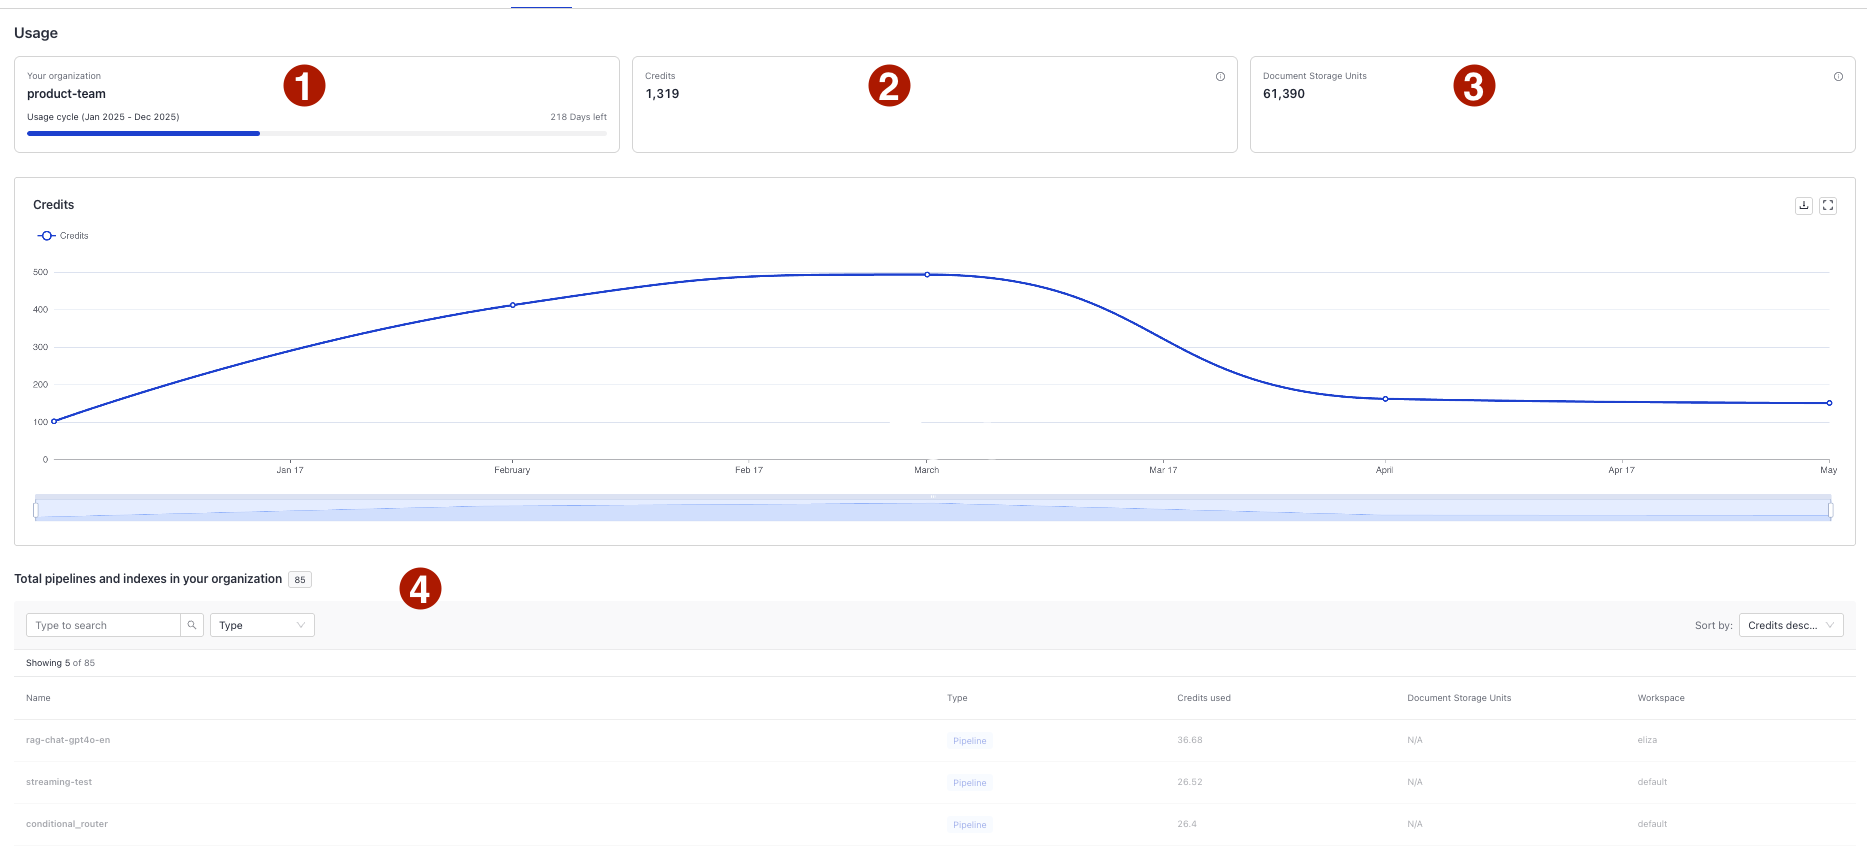
1. Your Organization
Your organization name and time frame for the usage data.
2. Credits
Credits are units that represent the number of hours your pipelines were deployed or your indexes were processing files. This includes pipelines that were deleted but contributed to credits usage during this usage cycle.
One credit is one hour of your pipelines being deployed or your indexes processing files.
You consume credits when:
- Your pipeline is deployed and active.
- Your index is actively processing files.
No credits are consumed when:
- Your pipeline is deployed but inactive, on standby.
- Your index is enabled but is not indexing any files as indexing is complete. Note that every time you upload a file, the index processes it, which counts toward credit consumption.
Production and Development Pipelines
Your pipelines can be either production or development. This affects the number of replicas they use and the number of credits they consume. You can configure the number of replicas and the idle timeout in pipeline settings.
- Production pipelines have at least one replica running by default and scale up to 10 with heavy traffic. The more replicas running, the more credits you use.
- Development pipelines have no replicas by default. For every hour a development pipeline is deployed and active, you use one credit.
For details on service levels and how to change them, see Pipelines.
What Changed: Credits vs Production and Development Hours
Previously, we tracked deployment hours separately for production and development pipelines. This included indexing time, as indexes were tied to query pipelines.
Now, we've simplified things. We no longer distinguish between development and production hours. Instead, we measure all active deployment time and all indexing activity in credits:
- One credit per hour per active replica
- One credit per hour of indexing
Estimating Your Credit Usage
When planning your credit usage, it's helpful to understand how credits are consumed across different parts of the system.
Query Pipelines
Credits for query pipelines are based on how long your pipeline is actively deployed and how many replicas it uses.
- Development pipeline: 1 credit per hour (no replicas by default)
- Production pipeline: 1 replica by default = 1 credit per hour minimum
If your production pipeline scales due to high traffic, credit usage increases proportionally with the number of active replicas (up to a maximum of 10). You can configure the minimum and maximum number of replicas in the pipeline's Settings tab.
Indexing
Credits for indexes are only used when files are being processed. You don’t need to index the same data more than once. After indexing, you can reuse that data across different query pipelines without additional credit costs.
Several factors can affect how many credits indexing will use:
- Size and number of files: Larger and more files take longer to process.
- Index configuration: Preprocessing steps like OCR or generating metadata with a language model increase processing time.
- Upload pattern: Uploading files in a single batch or in several large batches is more efficient. Uploading files one-by-one with long gaps in between may add warm-up time.
- Embedding model: The dimensionality of the embedding model, the number of models used, and whether they're hosted locally or accessed via API can impact speed and credit usage.
Example Credit Usage
Here are some rough estimates for how many credits are used by our standard index templates. This scenario assumes:
- 100 files in a mix of formats (TXT, HTML, XLSX, PDF, DOCX, CSV)
- All files uploaded together in one batch
| Index Template | Approximate Credits Used |
|---|---|
| Standard Index (English) | 0.03 |
| AI-Generated Metadata | 0.06 |
These figures can vary depending on your specific setup, but they offer a starting point for estimating costs.
3. Document Storage Units
Document Storage Units (DSU) show how much vector storage you're using for your indexed documents. The DSU count on the Usage page reflect the current state. They can go up or down as you add or remove documents.
When you upload and index your files, we split them into smaller pieces called documents. These documents are stored and your DSU count depends on two key factors:
- How many documents your files are split into.
- The size (dimensionality) of the embedding model used to process them.
The more documents or the larger the model, the more storage units you use.
Calculating DSUs
To calculate DSUs, we multiply the number of stored documents by a multiplier that reflects the embedding model's dimensionality:
- A standard embedding model with 768 dimensions uses a multiplier of 1.
- A larger model with 1,536 dimensions uses a multiplier of 2, meaning it needs twice as much storage.
- If you use keyword-based search or don't use vector storage, the multiplier is just 0.2, so it uses much less storage.
Example
Say you upload 5,000 files which are split into 83,697 documents:
- With the standard embedding model (768 dimensions):
83,697 documents × 1 = 83,697 storage units - With a larger model (1,536 dimensions):
83,697 documents × 2 = 167,394 storage units - With keyword search only or no vector storage:
83,697 documents × 0.2 = 16,739.4 storage units
Optimizing Storage Usage
As you near your storage capacity, you can reduce storage consumption by:
- Deleting duplicate files.
- Reducing irrelevant files, starting from the largest ones. Detecting irrelevant files is specific to your use case. You can use the Search History endpoint to check user queries, files, and documents used.
- Adjusting settings in DocumentSplitter:
- If your
split_overlapsetting is high, consider decreasing it. - If your
split_lengthsetting is low, try increasing it. Remember that it's important to avoid too large values to prevent Retriever and Generator components from cutting the documents.
- If your
4. Usage Per Pipeline or Index
At the bottom of the page, you can check the detailed usage per pipeline or index. You can check the number of credits used and the workspace it's in.
Indexes and pipelines that were deleted but contributed to usage in the current cycle are greyed out.
Was this page helpful?