Debug Your Query Pipelines Remotely
Debug your pipelines using a Visual Studio Code (VSCode) remote tunnel.
About This Task
Inspect, monitor, and debug your query pipelines running in the target environment—securely and without complex VPN or SSH setups. This method uses VS Code tunnels with GitHub authentication, accessible through a web browser, so you don’t need to install VS Code locally. For details on how the tunneling feature works, see VS Code documentation.
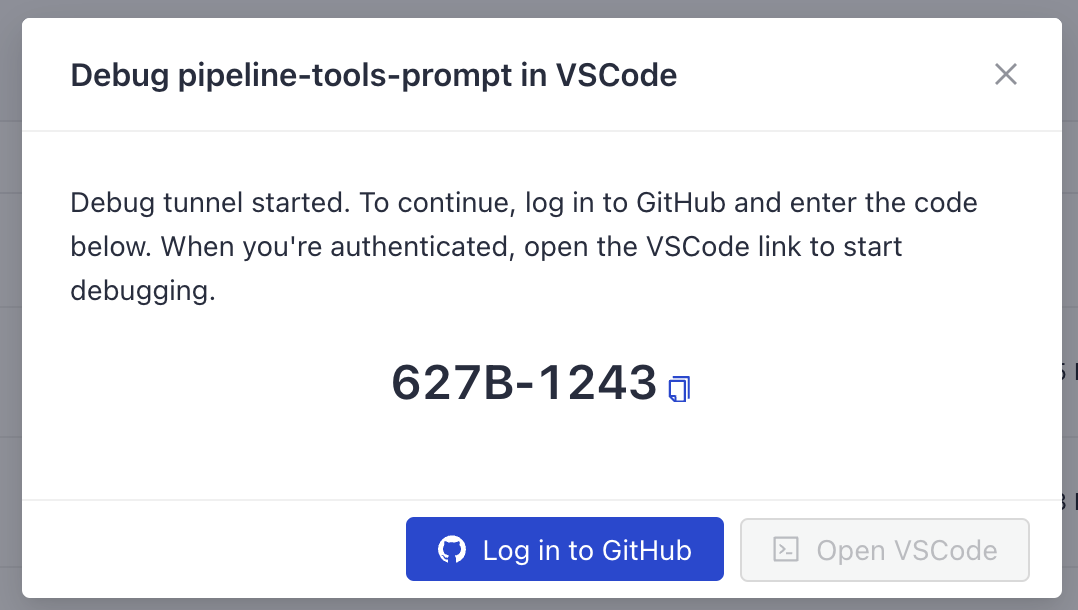
When you choose to debug your pipeline in VSCode, Haystack Enterprise Platform shows you a notification with a link and an eight-character code to authenticate in GitHub and a link to browser-based VSCode. The notification stays visible until you close it.
Setting up the tunnel may take a couple of minutes. If you open the link before the tunnel is ready, you'll see an error message saying the tunnel wasn't found. If this happens, reload the page after around 30 seconds.
After you authenticate in GitHub and you open VSCode, you can see a couple of files in the Debug folder in VSCode's Explorer:
pieline.yaml: This is the configuration of the pipeline you want to debug.debug_custom_component.pyanddebug_pipeline.py: These are sample files to show you how to debug custom components and pipelines, respectively.utlis.py: This is a sample file to show you how to set up your environment for debugging.
The debug tunnel stays open for 12 hours. After that time, it's automatically closed.
You can also debug your pipeline when testing it in Playground. Just click the debug icon and you'll be able to track all the steps your pipeline performs in real time. For details, see Test Your Pipeline in Playground.
Prerequisites
- A deployed and active pipeline to debug.
- A GitHub account.
- Advanced knowledge of VSCode and remote debugging.
- Good knowledge of Python.
Debug Your Pipeline
-
In Haystack Enterprise Platform, go to Pipelines.
-
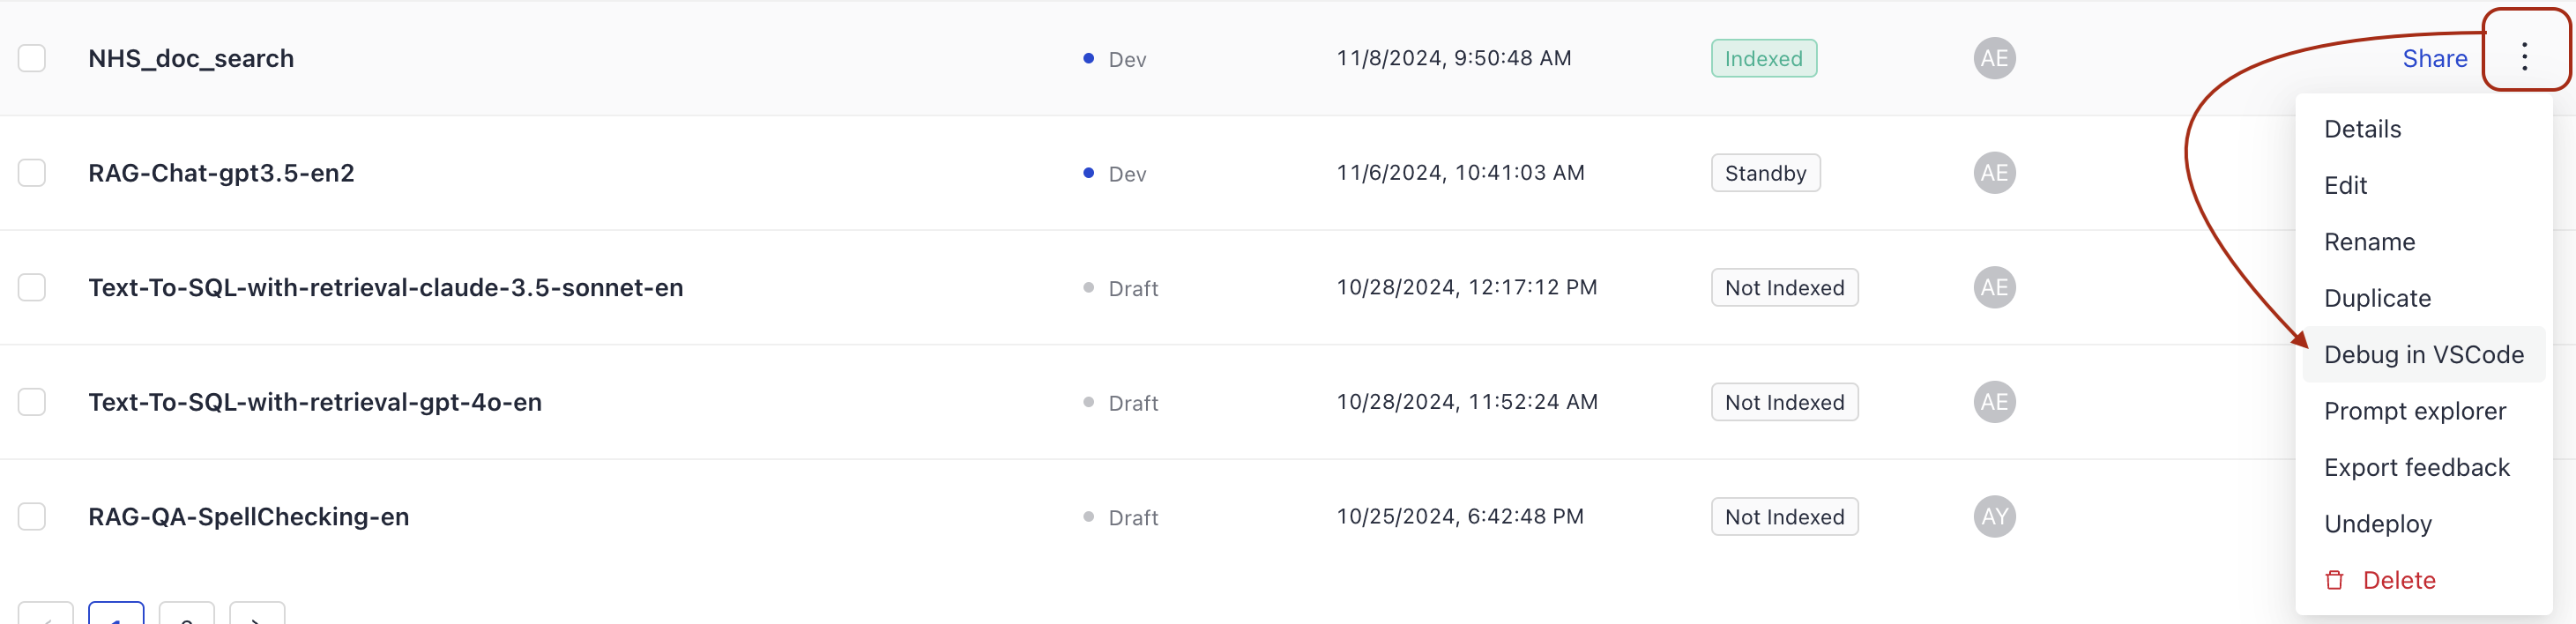
Locate the pipeline you want to debug, click the More Actions menu next to it, and choose Debug in VS Code.
-
When you see a notification at the top of the screen, click the GitHub link.
-
When you're redirected to GitHub:
- Log in to your GitHub account.
- When prompted, enter the code from the notification.
- Authorize Visual Studio Code.
-
When VSCode is successfully authorized, go back to Haystack Enterprise Platform and open the VSCode link in the notification. This takes you to a browser-based VSCode instance. You may need to authenticate the necessary VSCode extensions in GitHub.
You can find your pipeline in thepipeline.yamlfile. Use the sample Python files to understand how to debug it.
If the Python tools didn't load or you're getting a message the tunnel wasn't found, reload the page.
Was this page helpful?