This feature is no longer supported.
Check the Groundedness Score
Ensure your AI's answers are data-backed and reliable. Learn how to access and interpret the score using the Groundedness Observability Dashboard.
What's Groundedness Score?
The groundedness score is a retrieval-augmented generation (RAG) pipeline metric that measures how well-grounded the generated answers are in the documents. For your RAG pipelines, it's essential that the answers the LLM generates are grounded in your data. This ensures the generated content is based on information you can rely on and verify. It's especially important in apps where accuracy is critical. Users are also more likely to trust a system that consistently provides grounded and accurate information.
You can monitor your RAG pipelines' groundedness score using the Groundedness Observability Dashboard. The score ranges from 0 (poor groundedness) to 1 (very good; all answers are grounded in the data). It's calculated using a cross-encoder model as follows:
- For each sentence that requires verification, the model determines the highest groundedness score among all references supporting that sentence.
- The model calculates the average of these maximum scores for all verified sentences in a document. This gives the document's groundedness score.
- The overall groundedness score is the average of all individual document groundedness scores.
Only sentences that require verification are included in this calculation.
Using Observability Dashboard
-
Log in to Haystack Enterprise Platform and go to Groundedness.
-
Choose the pipeline whose groundedness you want to check and you should see the data.
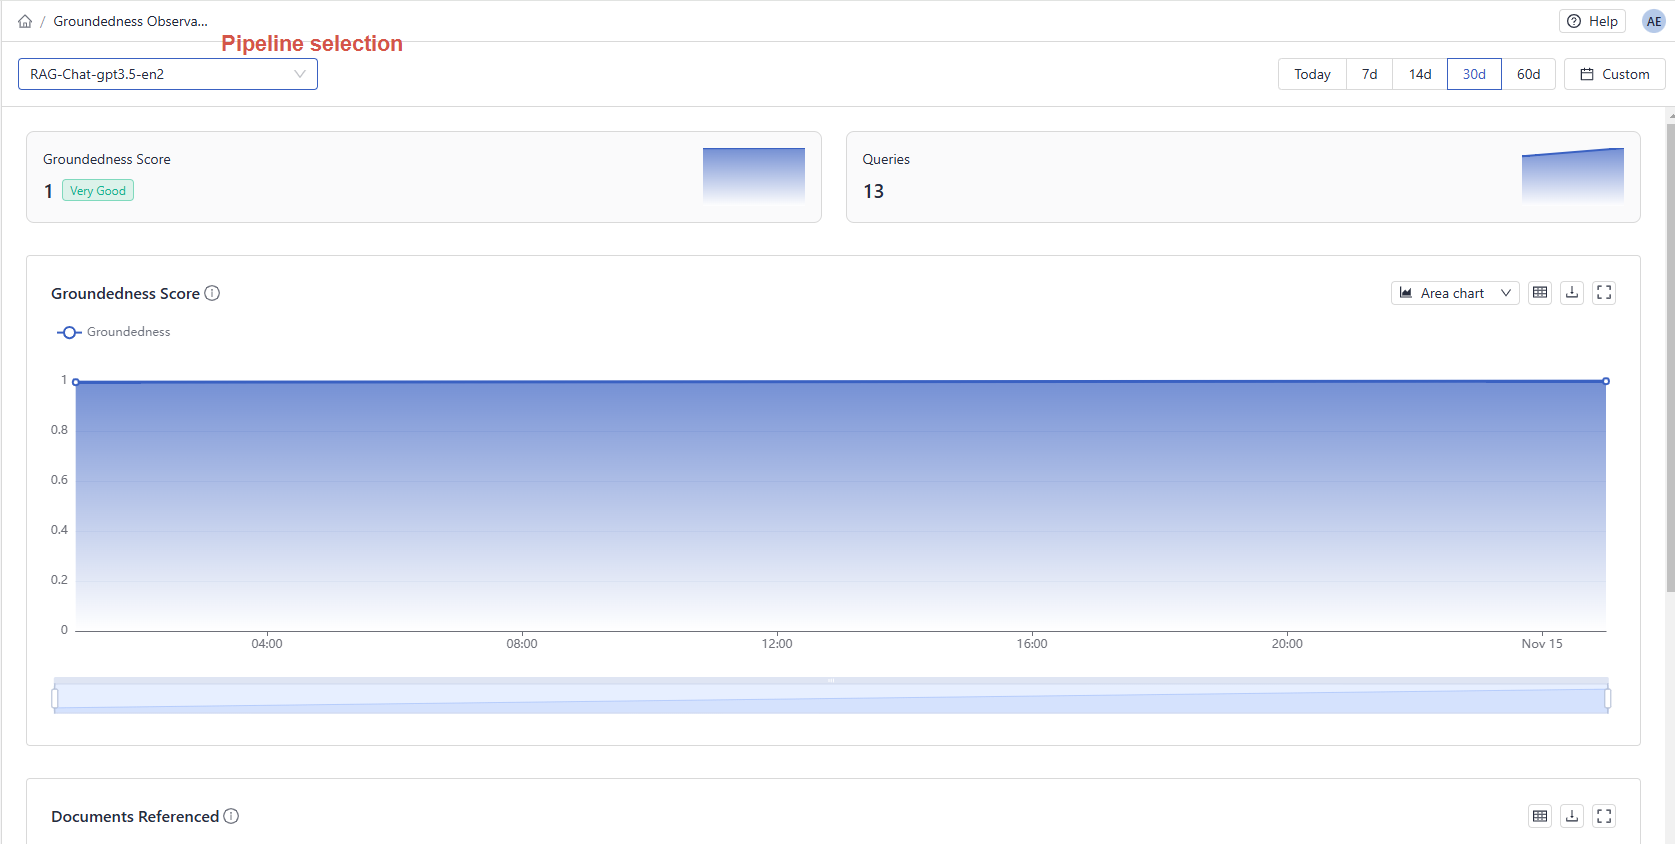
Navigating the Dashboard
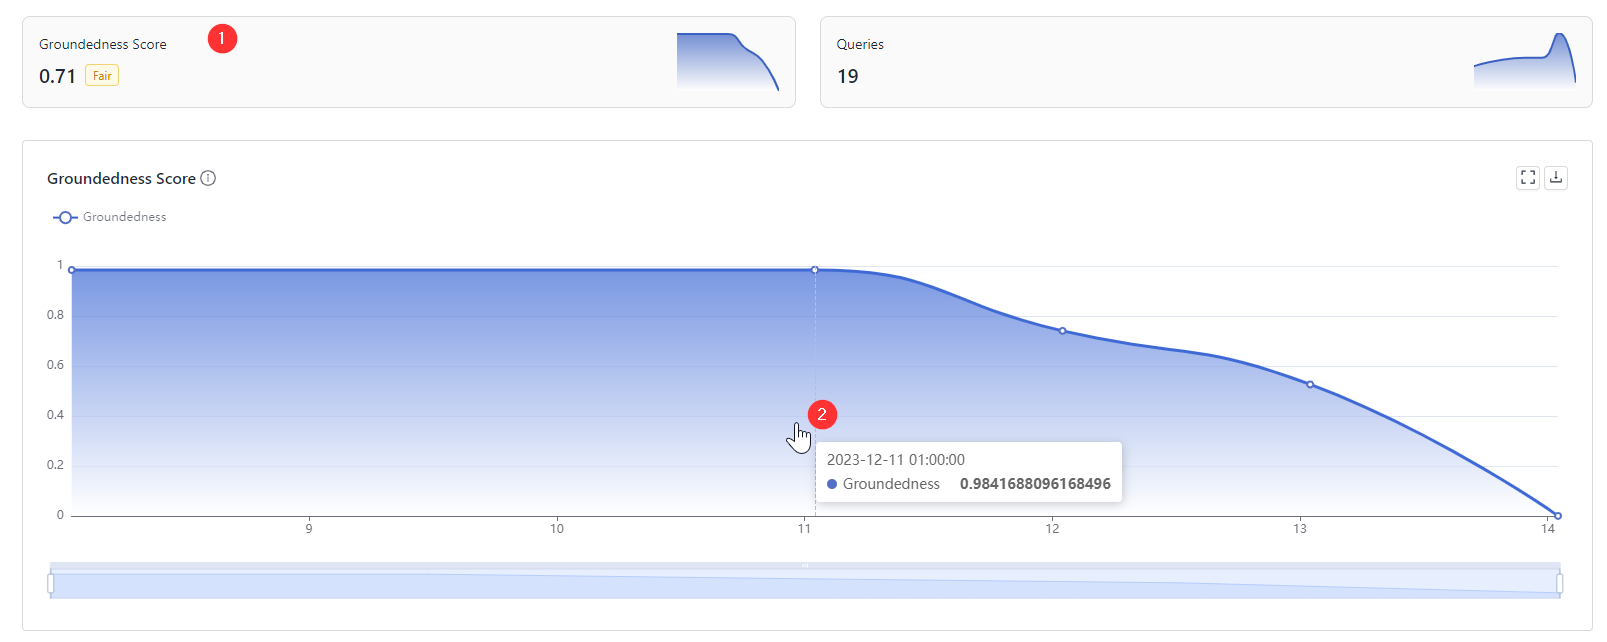
At the top of the dashboard, you can check the overall groundedness score for your pipeline (1). The graph in the Groundedness Score section shows how the score changed over time. Changes in groundedness can happen if the data, the model, or the pipeline is updated. By hovering your mouse over any point on the graph, you can see the average groundedness score for answers at that point in time (2).
You can choose the data's time range and switch between pipelines. The groundedness score is available only for retrieval augmented generation (RAG) pipelines.
The Documents Referenced section shows you how a document's ranking correlates with its reference frequency. The ranking comes from the pipeline (from the last component that ranks documents, typically a Ranker or a Retriever). Beneath each rank, you can see a percentage representing that document's share of all references.
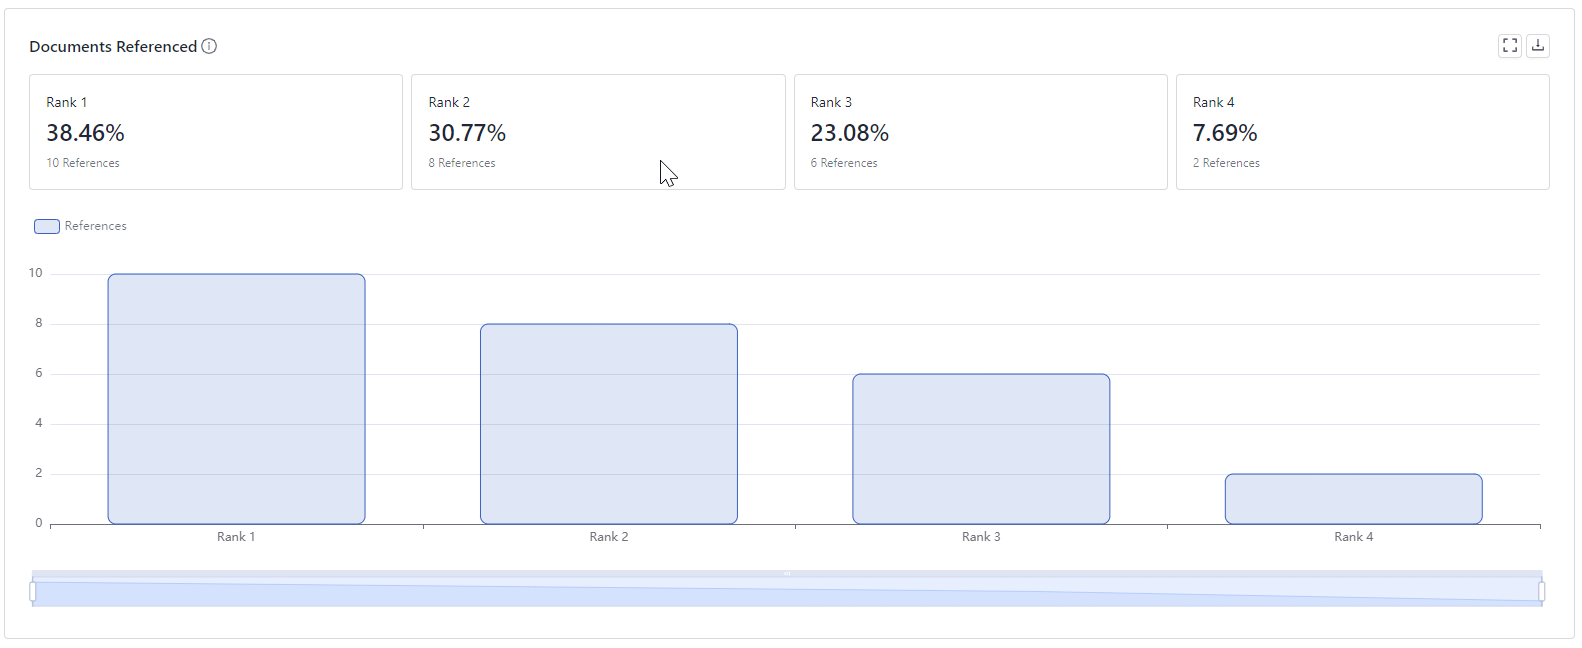
Understanding these metrics can help in several ways:
- It's an indication of your retriever's performance. If documents with lower ranks are referenced more often, it means the retriever could be improved.
- It's an opportunity to save costs. By identifying and excluding documents that are rarely used as references, you can reduce the number of tokens sent to the model in the prompt. For example, if documents ranked at 4 are not referenced anywhere, you can set the pipeline's
top_kto3. This way, only documents ranked 1 to 3 are sent in the prompt as the context to generate answers.
(Tip: Modify thetop_kparameter of the component that sends documents to PromptBuilder. In a RAG pipeline, this is typically theRetriever.)
Was this page helpful?