Debug with Builder
Fix your pipeline issues. Submit a query and examine the detailed component logs to understand how the component processed it to produce the final result.
About This Task
You can debug your pipeline by checking the component logs for each run. You can also use the Issues panel to see all validation and runtime issues in one place. Click Inspect next to any issue to jump directly to the affected component or connection and fix it. Click Fix with AI next to any issue to open the AI assistant, which reasons through the fix and can apply it for you.
Check Component Logs
You can inspect each component's logs per run to understand how the component processed the input and produced the output.
-
Open your pipeline in Builder.
-
Click Run Pipeline above the
Inputcomponent and type a query in the Playground window that pops up.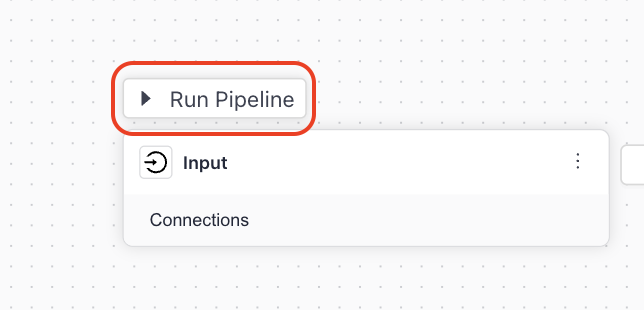
-
Wait until you get an answer and minimize the Playground window using the down arrow.
-
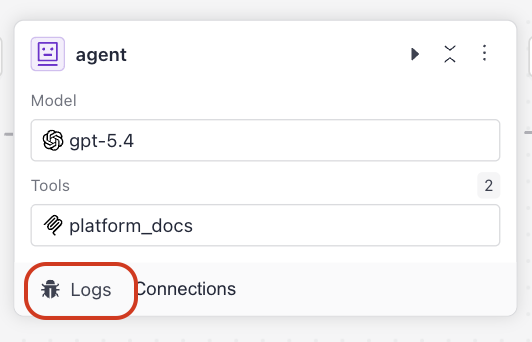
Check the components in your pipeline. There is a Logs tag on the components whose logs you can view. Click View on a component to see its output logs.
 Check the Issues Panel
After running the pipeline, you can also open the Issues tab at the bottom of Builder to see all runtime errors in one place. Click Inspect next to any issue to jump directly to the affected component. Click Fix with AI to open the AI assistant, which reasons through the fix and can apply it for you.
Component LogsComponent logs are automatically available for all components in your pipeline when debugging. This includes intermediate processing steps and outputs from each component, helping you trace how data flows through your pipeline.
Use the AI Assistant
Builder includes a built-in AI assistant you can chat with to get help debugging your pipeline. Click AI Assistant in Builder to open the chat panel.
Describe what's going wrong, paste an error message, or ask the assistant to help you understand unexpected behavior. The assistant was designed with debugging in mind, but you can use it for other things too — like getting help with pipeline design or understanding how a component works.
The AI assistant runs as a streaming chat, so responses appear as they are generated. Each session keeps context across turns, so you can follow up on previous questions without repeating yourself.
Debug Single Components
Run individual components to verify their settings, input and output, and check if they work as expected. For information on how it works, see Run Components in Isolation.
Was this page helpful?